User Guide

Types of Reports That Can Be Generated

The following five types of reports can be generated, depending on the purpose.

Device List (Information)

This displays a list of information from devices. It can aid in obtaining a grasp of those managed devices.

Report examples
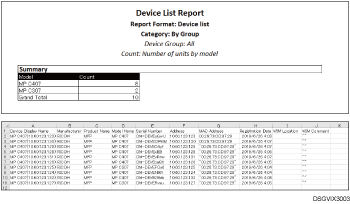
Illustration of report samples

The Device List report is designed to provide the following information:

Item

Description

Covered devices

MFPs and RICOH Interactive Whiteboard devices

Output format

Excel

Generated output

The following two different worksheets are generated:

  • Table of the aggregation results of the number of devices, by model

  • Values of information extracted from items displayed on the Device List (Information) screen

Limitations

If no information has been obtained from any device, the value is blank.

Counters (Device)

This calculates the counter values by device, and reports the results. It helps to check whether those MFPs have been used appropriately.

Report examples
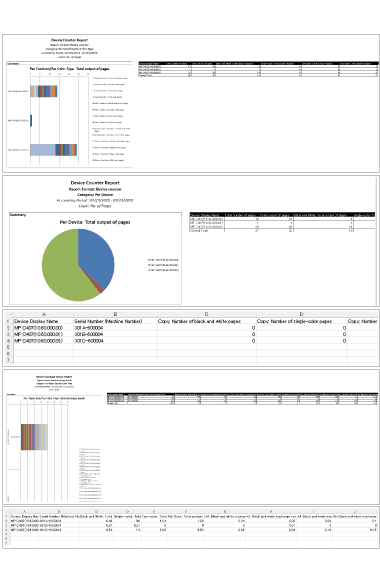
Illustration of report samples

The Counters (Device) report is designed to provide the following information:

Item

Description

Covered devices

MFPs

Output format

Excel

Generated output

The following five different worksheets are generated:

  1. A stacked bar chart of the utilization ratio of each function calculated by adding up the counter values from the covered devices by device, with their data in a tabular format.

  2. A pie chart of the sums of the counter values from the covered devices by device, with their data in a tabular format.

  3. A table of the sums of the counter values from the covered devices by device.

  4. This sheet contains a stacked bar chart of the costs spent per device, by adding up the counter values from all devices of the covered device group by paper size and color type, along with the corresponding data in a tabular form.

  5. This sheet contains the aggregation results (estimated costs spent) per device, by adding up the counter values from the covered devices.

  • If no data is present during the aggregation time interval, only the above worksheet numbered 3 is generated, with a message saying, “No data during the aggregation period”.

  • If "Uniform" is selected for "Setting Type" in the "Cost Allocation Table", all items are included. If Custom is selected for Setting Type in Cost Allocation Table, a sum is included for each of the sizes selected and not selected.

Limitations

  • If no job log has been sent, no aggregation occurs.

  • The aggregated values in the report may differ from those of the counter values displayed in Device Details and in the accounting counter.

  • If no cost allocation table is specified, sheet 4 or 5 is not generated.

Counters (User)

This calculates the counter values by user, and reports the results. It can aid in obtaining a grasp of device utilization by user.

Report examples
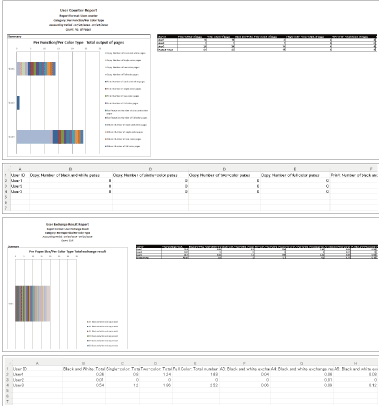
Illustration of report samples

The Counters (User) report is designed to provide the following information:

Item

Description

Covered device

MFPs

Output format

Excel

Generated output

The following four different worksheets are generated:

  1. A stacked bar chart of the utilization ratio of each function calculated by adding up the counter values from the covered devices by function, with their data in a tabular format.

  2. A pie chart of the sums of the counter values from the covered devices by function, with their data in a tabular format.

  3. A table of the aggregation of counter values from the covered devices by function, provided by user. For any job without a registered user ID, aggregation by serial number occurs.

  4. This sheet contains the aggregation results (estimated costs spent) per user, by adding up the counter values from the covered devices by user.

  • If no data is present during the aggregation time interval, only the above worksheet numbered 3 is generated, with a message saying, “No data during the aggregation period”.

  • If "Uniform" is selected for "Setting Type" in the "Cost Allocation Table", all items are included. If Custom is selected for Setting Type in Cost Allocation Table, a sum is included for each of the sizes selected and not selected.

Limitations

  • If no job log has been sent, no aggregation occurs.

  • The aggregated values in the report may differ from those of the counter values displayed in Device Details and in the accounting counter.

  • If no cost allocation table is specified, sheet 4 is not generated.

Counters (Group)

This calculates the counter values by user, aggregates the values by group to which each user belongs, and reports the results. It can aid in obtaining a grasp of inter-group transfers and device utilization by group.

For details on how to create a department master, see How to Create a Department Master.

Report examples
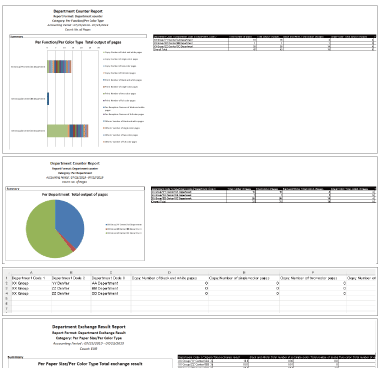
Illustration of report samples

The Counters (Group) report is designed to provide the following information:

Item

Description

Covered devices

All MFPs registered in the administrator's tenant.

Output format

Excel

Generated output

The following five different worksheets are generated:

  1. Stacked bar chart of the ratio of use by department by aggregating the counter values from all covered devices by function, with data in tabular format

  2. Pie chart of the ratio of each function's counter values by aggregating the counter values from the covered devices by department, with data in tabular format

  3. Table of the aggregation results by department by counting the counter values from the covered devices, by user

  4. This sheet contains a stacked bar chart of the costs spent per department, by adding up the counter values from all devices of the covered device group by paper size and color type, along with the corresponding data in a tabular form.

  5. This sheet contains the aggregation results (estimated costs spent) per department, by adding up the counter values from the covered devices.

  • If no data is present during the aggregation time interval, only the above worksheet numbered 3 is generated, with a message saying, “No data during the aggregation period”.

  • If "Uniform" is selected for "Setting Type" in the "Cost Allocation Table", all items are included. If Custom is selected for Setting Type in Cost Allocation Table, a sum is included for each of the sizes selected and not selected.

Limitations

  • If no job log has been sent, no aggregation occurs.

  • The aggregated values in the report may differ from those of the counter values displayed in Device Details and in the accounting counter.

  • If no cost allocation table is specified, sheet 4 or 5 is not generated.

Counters (Billing Code)

This calculates the counter values by each billing code, and reports the results.

Important

  • In some regions where this service is available, Counters (Billing Code) may not be available.

Report examples
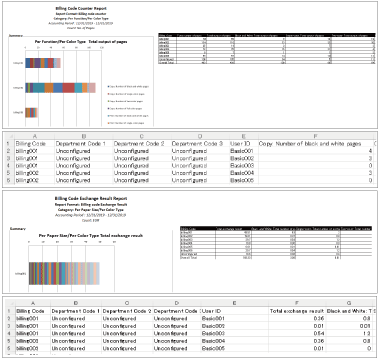
Illustration of report samples

The Counters (Billing Code) report is designed to provide the following information:

Item

Description

Covered devices

MFPs

Output format

Excel

Generated output

The following four different worksheets are generated:

  1. A stacked bar chart of the utilization ratio of each function calculated by adding up the counter values from the covered devices by each billing code, with their data in a tabular format

  2. A table of the aggregation of counter values from the covered devices by function, provided by each billing code, group code, and user ID

  3. This sheet contains a stacked bar chart of the costs spent per classification code, by adding up the counter values from all devices of the covered device group by paper size and color type, along with the corresponding data in a tabular form.

  4. This sheet contains the aggregation results (estimated costs spent) per classification code and user ID, by adding up the counter values from the covered devices by classification code, department code, and user ID.

  • If no data is present during the aggregation time interval, only the above worksheet numbered 2 is generated, with a message saying, "No data during the aggregation period".

  • A job with no registered billing code is aggregated as "Unconfigured".

  • If a report is generated without setting a group master, group codes 1, 2, and 3 are all marked as "Unconfigured".

  • If "Uniform" is selected for "Setting Type" in the "Cost Allocation Table", all items are included. If Custom is selected for Setting Type in Cost Allocation Table, a sum is included for each of the sizes selected and not selected.

Limitations

  • If no job log has been sent, no aggregation occurs.

  • The aggregated values in the report may differ from those of the counter values displayed in Device Details and in the accounting counter.

  • If no cost allocation table is specified, sheet 3 or 4 is not generated.